|
|
|

|
|
| ダウンロード | |
| 編集 | |
| 作成 | |
|
|
|
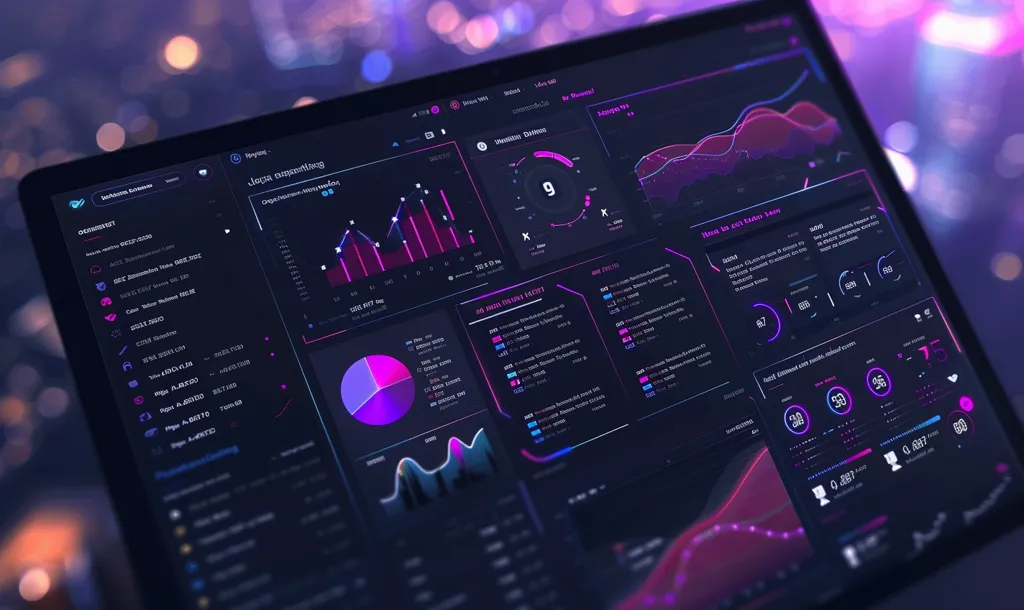
| タイトル | Dashboard displaying company's performance data for management decision-making. |
| 説明 | The image is a dashboard that displays a variety of information, including graphs, charts, and text. The graphs show the performance of a company over time, while the charts show the company's financial information. The text provides additional information about the company's performance. The dashboard is designed to provide a comprehensive view of the company's performance and is used by managers to make decisions. |
| 解像度 | 1024x610 |
| 創造性 | |
| 好き | 100 |
| から | 画像の出典をクリックしてください (1424 x 848) |
| Model | Midjourneyv6.0 |
| 微調整 | |
| LoRA | |
| プロンプト | Generate a dashboard for digital marketing agency in vilolet light colors and black theme indesktop format but without any mockup for pc, --ar 5:3 |
| ネガティブ プロンプト | |
| パラメータ | |